From 10% to 50% Debt: How Much Volatility Can Equity Investors Reduce?
A 25-year WhiteOak Capital study shows how adding debt to an all-equity portfolio changes volatility and returns, with the actual numbers.
- Adding 10% debt cut volatility from 25.34% to 22.68% and return from 18.58% to 17.39%.
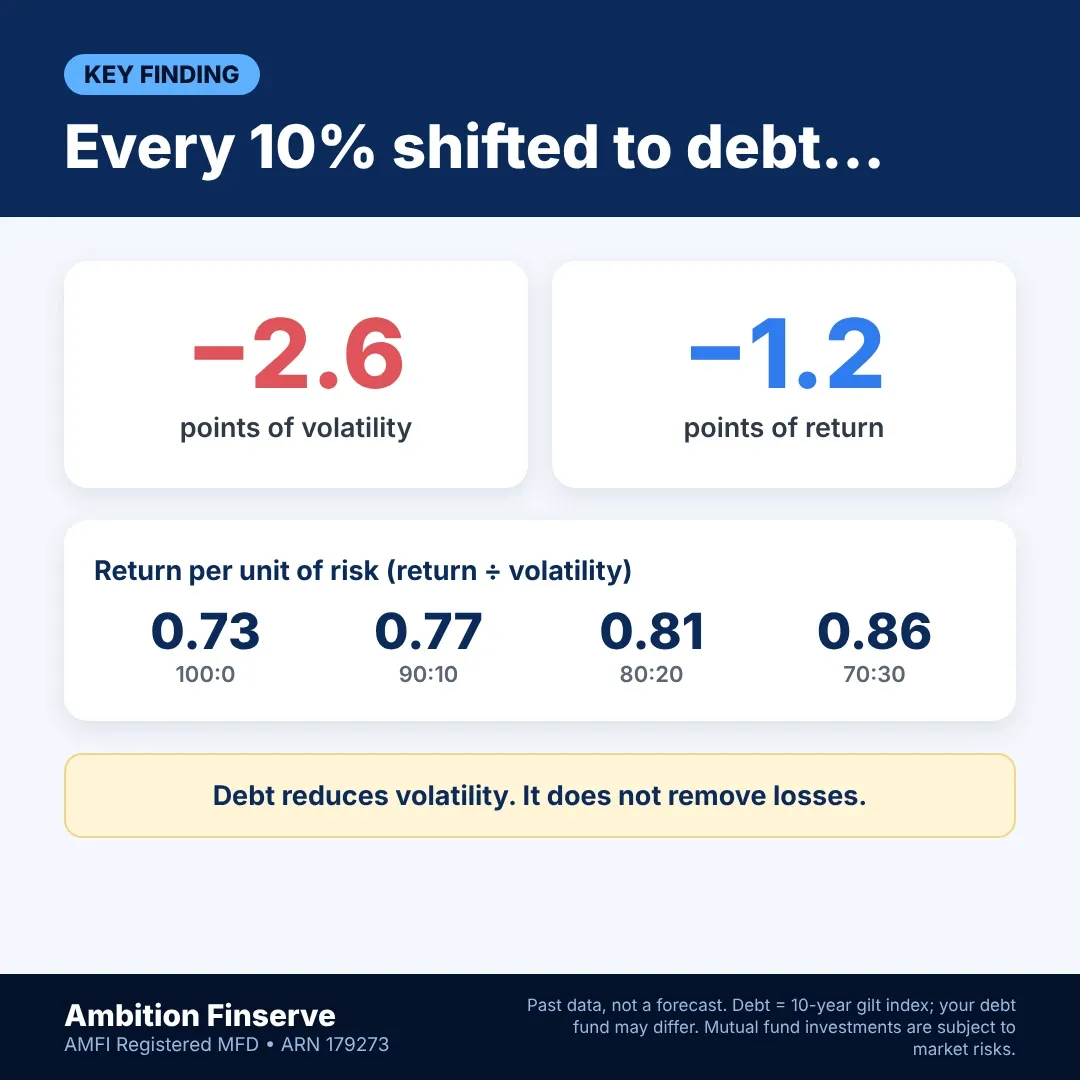
- In this study, each 10% of debt reduced volatility by about 2.6 points and return by about 1.2 points.
- Return per unit of risk improved as debt increased.
- Debt reduces swings but does not protect against losses.
- The right allocation depends on your time horizon, goals and risk tolerance.
Introduction
Every equity investor knows the feeling. When markets rise, it is great. When they fall 20-30%, it is hard to sleep.
That raises a practical question: can adding some debt to your portfolio smooth out those swings, and what does it cost?
WhiteOak Capital Mutual Fund tested this with data. Its analysis covers September 2001 to September 2026 and looks at what happens when an investor adds a debt buffer to a pure stock portfolio. This post walks through each allocation, with numbers.
How was the study done?
Before the numbers, it helps to know where the data comes from:
- Period: September 2001 to September 2026 (about 25 years)
- Equity: BSE Sensex TRI
- Debt: Crisil 10 Year Gilt Index (a 10-year government bond index)
- Method: Average 1-year rolling return, calculated daily, and the standard deviation (volatility) of those returns
The index and method details come from WhiteOak's own factsheet for an earlier edition of this study.
Results by allocation
| Equity : Debt | Avg. Annual Return | Volatility |
|---|---|---|
| 100 : 0 | 18.58% | 25.34% |
| 90 : 10 | 17.39% | 22.68% |
| 80 : 20 | 16.21% | 20.05% |
| 70 : 30 | 15.03% | 17.44% |
| 50 : 50* | ~12.7% | ~12.4% |
*The 50:50 figure is from an earlier edition of the same study (Sept 2001 to April 2026), so the period is slightly different from the rows above.
Step 1: What happens with just 10% debt?
Moving just 10% of an all-equity portfolio into debt brings volatility down from 25.34% to 22.68%, a drop of about 2.6 percentage points. The cost is that average annual return falls from 18.58% to 17.39%, roughly 1.2 percentage points.
Step 2: What about 20% and 30% debt?
At an 80:20 split, volatility is 20.05% and return is 16.21%. At 70:30, volatility is 17.44% and return is 15.03%.
One pattern stands out. Each extra 10% of debt has almost the same effect (these figures are Ambition Finserve's own calculations from the numbers above):
| Each additional 10% debt | Volatility change | Return change |
|---|---|---|
| 100 to 90 | -2.66 points | -1.19 points |
| 90 to 80 | -2.63 points | -1.18 points |
| 80 to 70 | -2.61 points | -1.18 points |
In this data, every 10% shifted to debt cut volatility by about 2.6 points and return by about 1.2 points. The trade-off is close to linear.
Step 3: Return per unit of risk
The key question is whether you give up more return than the risk you remove. A simple check is Return ÷ Volatility (Ambition Finserve's own calculation, not a WhiteOak figure):
| Equity : Debt | Return ÷ Volatility |
|---|---|
| 100 : 0 | 0.73 |
| 90 : 10 | 0.77 |
| 80 : 20 | 0.81 |
| 70 : 30 | 0.86 |
The return earned per unit of risk improved as debt increased. The first 10% of debt cut volatility by about 10.5% but cut return by only about 6.4%. At 30% debt, volatility was down about 31% while return was down about 19%.
Debt removed more risk than it removed return, so the portfolios looked better on a risk-adjusted basis.
Why does debt reduce volatility?
The main reason is that stocks and bonds often react differently to market conditions. Stocks follow corporate performance and economic sentiment, while debt instruments like government bonds are more sensitive to interest rates and bond yields.
When the two move differently, one can cushion the other's fall. That is the core benefit of diversification.
Does debt make you "safe"?
No. Investors should not mistake lower volatility for protection against all losses. Even a portfolio with a debt portion can fall significantly during a severe market correction.
Limitations to keep in mind
- The debt proxy is a 10-year government bond index. Real investors usually hold debt through mutual funds, which carry different risks, including credit quality, duration and the effect of interest rate hikes. Your debt fund may behave differently from the index.
- This is past data. Indian equities did very well over this period, and there is no guarantee the future will look the same.
- Average rolling return is not the same as CAGR. The 18.58% is an average of 1-year rolling returns, which can look higher than the compounded return you would actually earn. Use these figures to compare allocations with each other, not as a forecast.
- Taxes and expense ratios are not included, and both affect real-world returns.
Who might choose which allocation?
General thinking, not personal advice.
- Long horizon (10+ years), comfortable with swings: 90:10 or 80:20, a small cushion with most of the growth intact.
- Tend to panic or stop SIPs in a downturn: 70:30 or more debt. Giving up a little return can be better than bailing out mid-crash.
- Need the money in 3-5 years: keep equity lower, since equity can easily be negative over that span. Fixed income options may suit this goal.
- Rebalance: once a year, bring the portfolio back to its target mix. Otherwise rising equity quietly increases your risk. A structured financial plan makes this easier.
- Not sure where you fit? Take the Risk Profile test and try the financial calculators to see how different mixes could grow.
FAQs
Q1. Is adding 10% debt worth it?
Volatility fell, but so did return. Whether that is worth it depends on your goals and how much risk you can handle.
Q2. Will debt stop me from losing money?
No. It softens the fall but does not prevent it.
Q3. What does "debt" mean in this study?
A 10-year government bond (gilt) index. Your debt mutual fund may perform differently.
Not sure which equity-debt mix suits you?
Ambition Finserve is an AMFI-registered mutual fund distributor with 26+ years of experience, serving families, business owners and NRIs across Rajasthan and India. Book a free portfolio review to talk through your goals, time horizon and comfort with risk.
Get Free Portfolio ReviewShop No. 15, 1st Floor, Shanti Tower, Chang Gate, Beawar, Rajasthan 305901
Disclaimer: This document is for information only and is not investment advice. Past performance is not a guarantee of future results. Mutual fund investments are subject to market risks, read all scheme related documents carefully. Please consult a SEBI-registered financial advisor before investing.
Ambition Finserve is an AMFI Registered Mutual Fund Distributor. ARN-179273 | EUIN-E361148.
Sources: WhiteOak Capital Mutual Fund study (Sept 2001 to Sept 2026) as reported by Whalesbook (26 Oct 2026); WhiteOak's Sept 2026 factsheet; Business Standard and Moneycontrol/TradingView reports (for the earlier-edition 50:50 figures).